
Transitive Closure in PostgreSQL
At Remind we operate one of the largest communication tools for education in the United States and Canada. We have...

At Remind we have built a robust communication platform that makes it easy for educators, students, and parents to work together. Our users use Remind to keep classes organized, to help each other with school assignments, and to send out announcements for school events. Given these important use cases, users depend on Remind to deliver out their messages on time and reliably. As we scale, grow and change our systems to support all our users and meet their expectations, issues are bound to happen. When issues do happen, it is critical to identify and resolve them quickly to reduce the impact on our users. Throughout the years, we have developed techniques and common patterns that are useful when fixing issues. In this post, we’ll walk through a process of using hypothesis testing to guide us in fixing an issue.
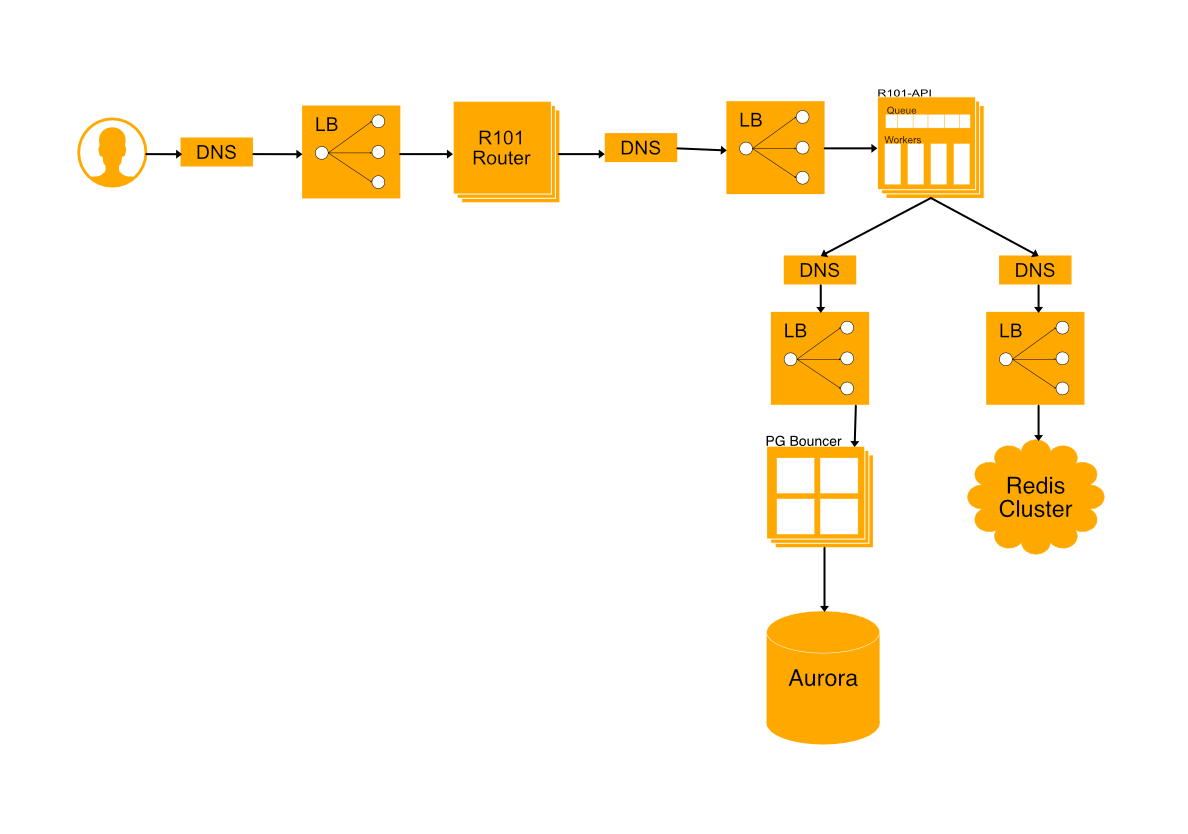
Our architecture is a pretty standard microservice architecture (mixed with a legacy monolith). We have a routing layer that takes each user request and routes it to the appropriate service. Each service consumes other systems like databases or cache and lives behind a load balancer so that we can scale independently to handle our load. All of this is running on AWS spread out across multiple availability zones for robustness. While this serves us well, it adds an additional layer of complexity when we are debugging issues and incidents. We’ll be going through an example which touches multiple services as well as our legacy monolith, which is called r101-api.
The first step for debugging an incident is to have monitors in place. With a monitor in place, notifications can be put in place to alert the appropriate people when an issue arises. Creating a good monitor is a topic in and of itself, but a good place to start is to alert when a threshold of failing requests is reached. Once we have an initial measurement of a potential issue, we can start to diagnose it and look at the data to form a hypothesis of what we think the issue is. From there, we can start to investigate the impacted system to verify or reject our hypothesis and lead us to incident resolution.
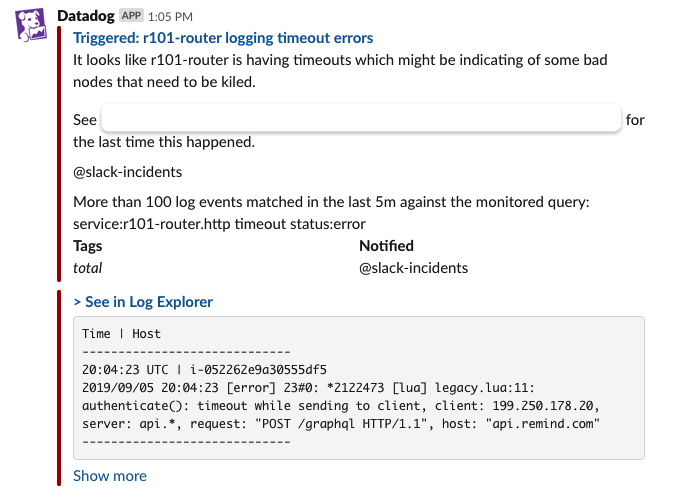
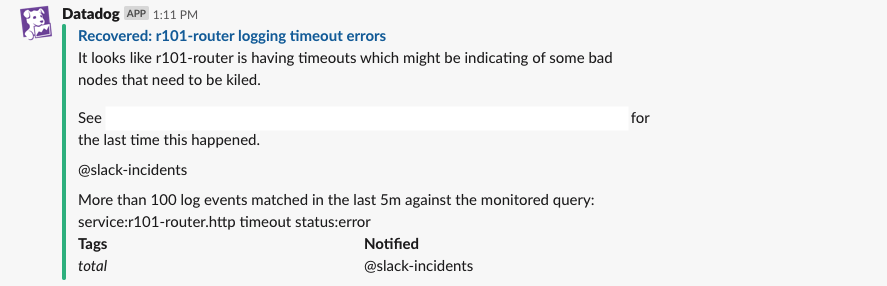
In this case, we’ve received a notification that our routing service is timing out.
Since our routing service is the main entry point for the rest of our application, we need to verify if this is an issue within our system or not. If this is an issue that is outside our system, like a third party vendor having issues of their own, then a different process is required to resolve it. With this in mind, we can build a hypothesis:
This is an issue in our system.
With our hypothesis in place, we can start to dig into metrics to verify or reject our hypothesis. Since we’re wondering whether this is an issue in our system, we need to know what can potentially happen outside our system, including power outages or network problems. Because we’re running on AWS spread across availability zones, it’s highly unlikely that an outside issue would affect all zones, so if we see error in just a single zone, then we can assume it’s an outside issue. Let’s take a look:
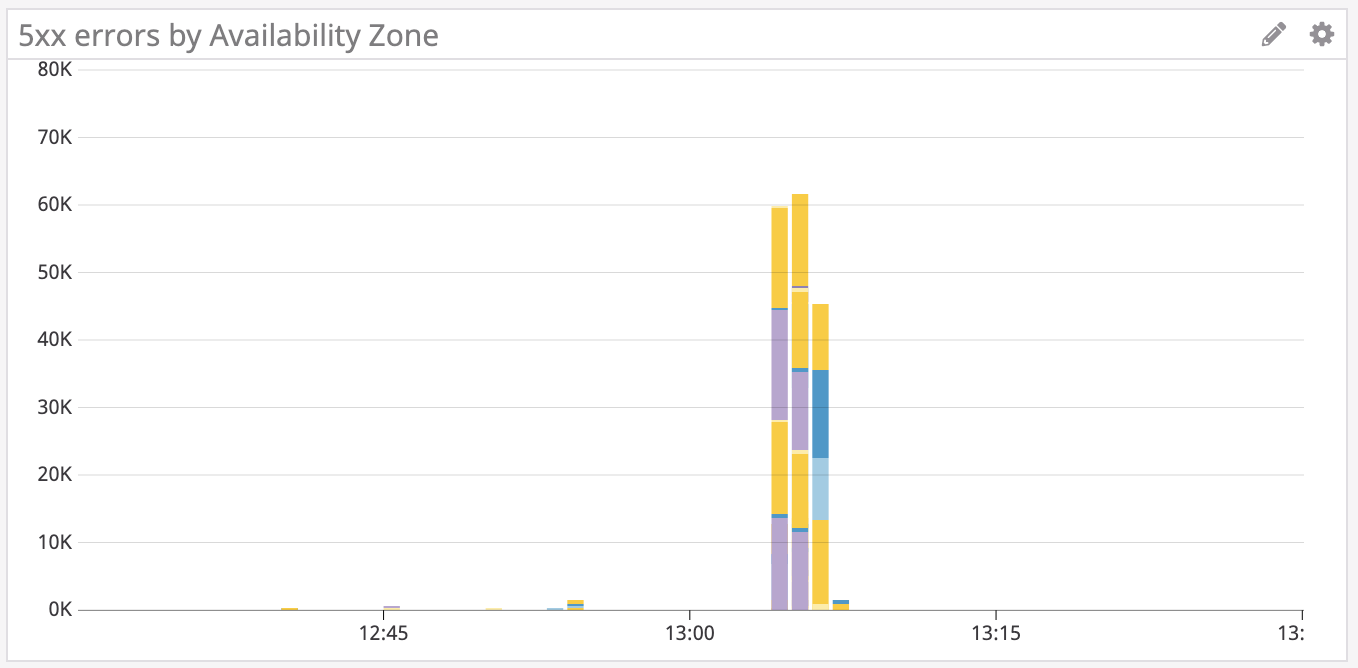
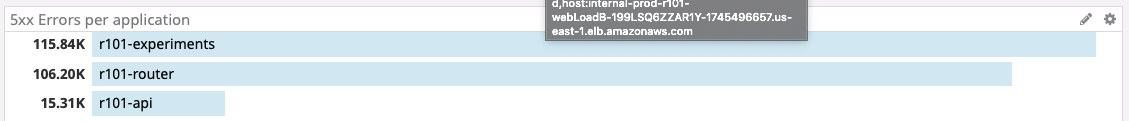
Since the errors are distributed among all availability zones, this seems to be an issue in our system. The router makes calls to other services and acts as a proxy, so we can conclude that the errors are coming from an upstream service. Searching for errors upstream, we see that there’s an increase in errors in two other services: r101-experiments and r101-api.
The timing in these errors don’t look like a coincidence, so from here we can build another hypothesis:
The errors in these two services are related.
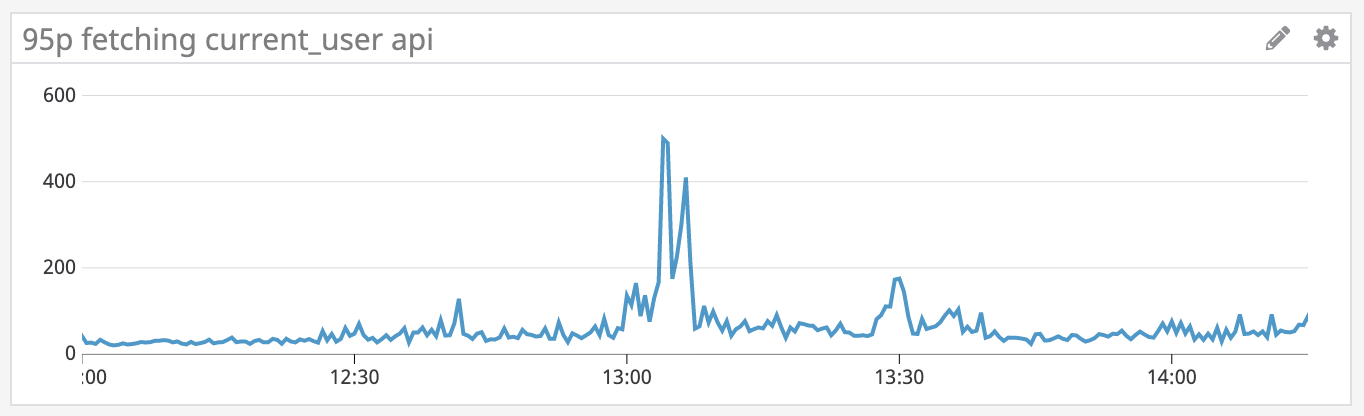
Since there are more errors in r101-experiments, let’s start from there. Looking at r101-experiments we see that there is an increase in how long requests complete for the /features/current_user HTTP endpoint. The APM trace for the endpoint having issues shows us the following:
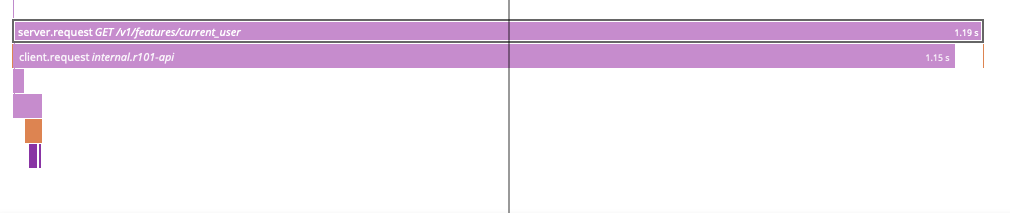
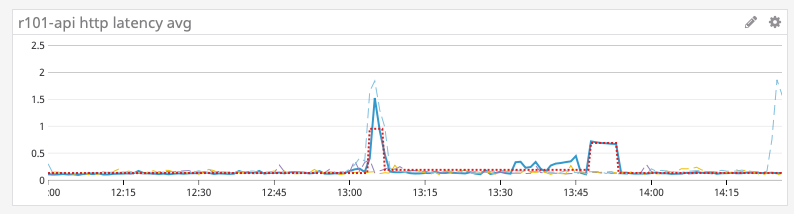
This particular endpoint tries to retrieve the user from cache; if there’s a cache miss, then it will make a request to r101-api to retrieve the user. Given that most of the time is spent waiting for the request to r101-api to complete, let’s look at it to see if it’s having any issues. Looking at the particular endpoint in r101-api that r101-experiments is calling, we do in fact see an increase in latency.
With this we can conclude that the errors in r101-experiments and r101-api are related to each other.
From here we can continue to narrow down our hypothesis:
r101-api is currently under load and should be scaled up.
Upon further investigation into metrics in r101-api, we see that the request queue has increased.
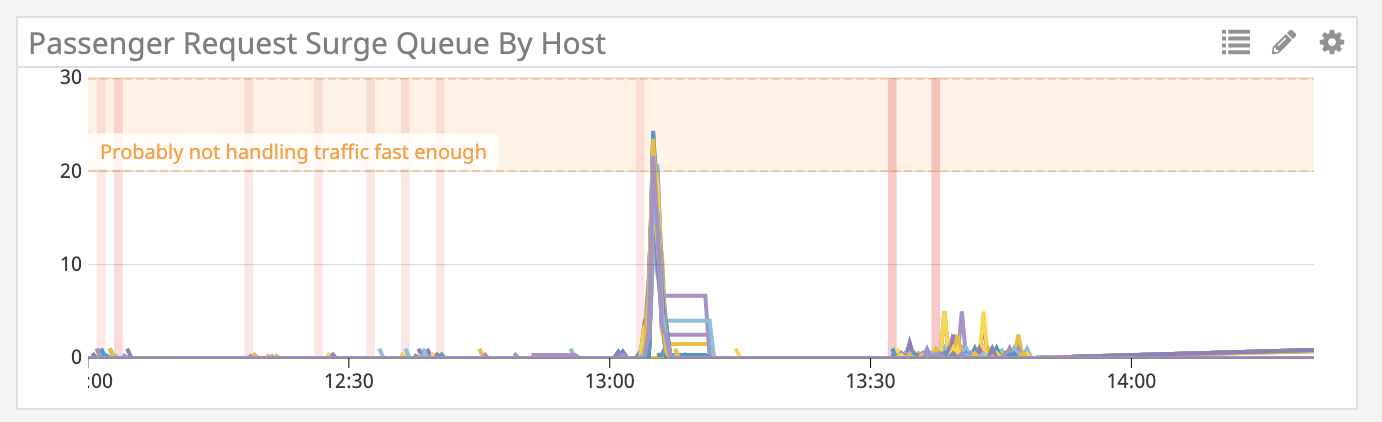
An increasing request queue size means that we are receiving more requests than we are able to handle. If we aren’t able to keep up with requests, either we are getting more traffic or we are taking longer to fulfill requests. Let’s look at the problematic endpoint to see what is going on. The r101-api endpoint is pretty simple:
    get :basic do
      present current_user, with: Entities::User::Basic
    end
It’s just accessing the database in order to retrieve the user for the specific request. Looking at metrics for the database we do see an increase in how long queries are taking to complete. This tells us that r101-api is working fine and that the errors are coming from the database.
Since the database query is a simple select query, we can build a new hypothesis:
The database is under load and it should be scaled up.
If the database is under load, we should expect to see a high CPU utilization for the database, so let’s look at the data to validate.
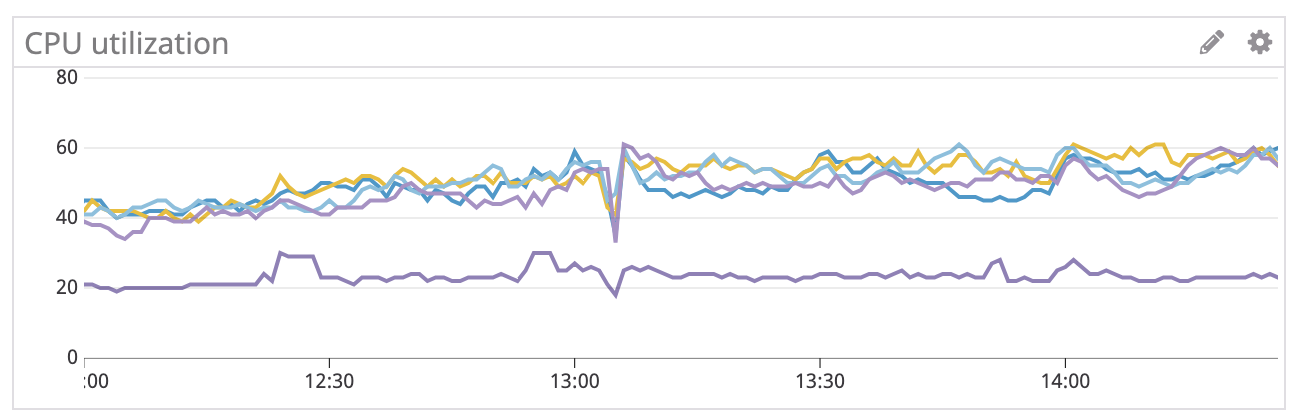
There’s actually a decrease in CPU utilization, which tells us that the database is not under load and the issue is somewhere else. However, we do see an increase in database connections.
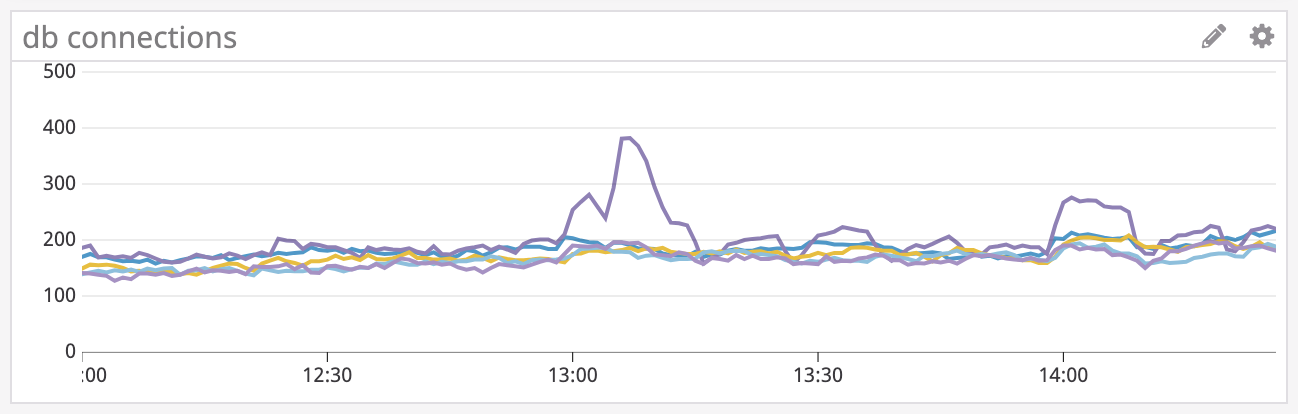
With these two pieces of information, we are able to reject our hypothesis and verify that the database is not the issue. Since the database is running fine, and r101-api is having errors, something between them is having issues. The only service that fits this description is PgBouncer, which effectively acts as a load balancer for the database.
With this new information, we can build a new hypothesis.
PgBouncer is under load and it should be scaled up.
By investigating PgBouncer metrics, we quickly find the following:
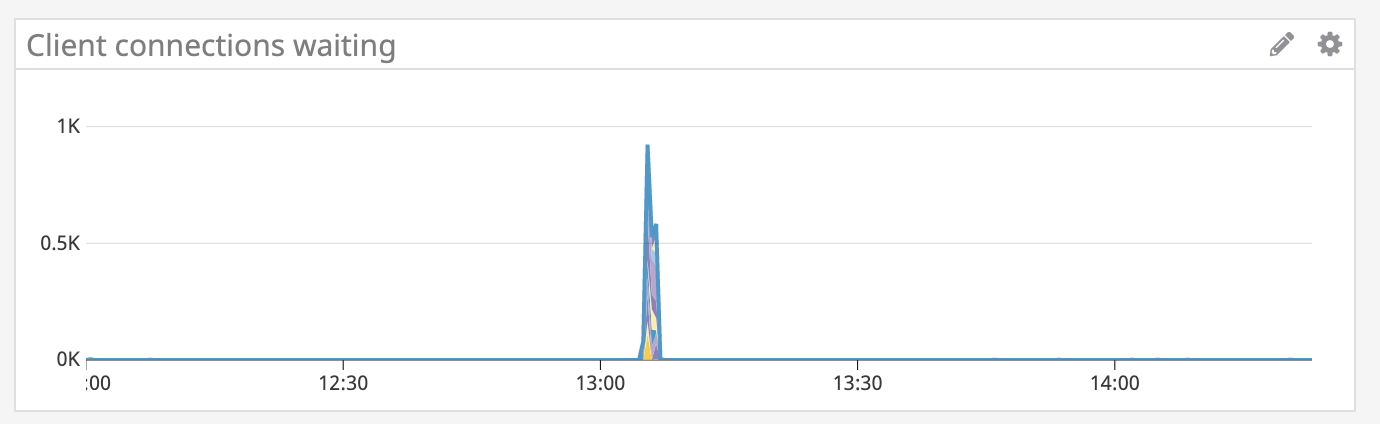
This tells us that PgBouncer is not able to handle all the connections. Since there are connections waiting, the fix is to scale PgBouncer so that more instances are available to process them. With PgBouncer scaled up, we start to see a decrease in the number of waiting connections. After some time, we also see a significant decrease in timeouts until eventually everything returns back to normal.
Remind treats production incident resolution as rapid hypothesis testing. Through the process of debugging this incident, we began by looking at initial measurements of our system, then stated a hypothesis of what we thought the issue was and looked at the data to prove or reject it. With each iteration, we refined our hypothesis as we learned more about the issue. By repeating this process, we were able to quickly and systematically identify the cause of an issue.